
Portfolio — 2026
I turn operational data into clear decisions.
Order-to-delivery operations experience, turned into Power BI, SQL and Excel reporting that makes risk visible and names the next action.
Define the question — the decision it supports and what a good answer looks like.
Build the evidence — clean, model and validate the data into something you can trust.
Drive the decision — turn the finding into a cause, an owner and a next step.
Power BI · SQL Server · Excel · Power Query · DAX · Business Central · Xero
Power BI, SQL Server, DAX, Power Query, Excel, star schema and data modeling, KPI governance, requirements, process mapping, UAT, RAID logs, Business Central, Xero, dashboards, and AI-assisted workflows.
Selected work
2026Four self-directed analytics projects, built end-to-end on synthetic data modeled on real order-to-delivery operations. Each ships a case-study PDF and its working file.
420-order model, data dictionary, star schema, 8 governed KPIs and a live interactive dashboard.
Output delivery-risk, supplier and overdue-cash exposure in one weekly view — every figure traceable to source.
69.4% on-time delivery · 45.7% of delayed value ($1.24m) traced to a single root cause
360 invoices turned into aging, a DSO proxy, promise coverage and a cash-priority queue.
Output a ranked list of which invoices to chase first, by expected cash and customer risk.
88.7% of the book overdue · only 30.5% of that exposure covered by a payment promise
300 purchase orders scored for spend, OTIF, fill rate, price variance, defects and supplier risk.
Output every supplier sorted into a risk tier, with the drivers behind each score.
37.7% OTIF against a 98.9% fill rate — a lead-time problem, not a quality one
24 requirements with acceptance criteria, traceability, 30 UAT cases and readiness reporting.
Output 24 requirements as tested, signed-off, fully traceable delivery evidence.
100% traceability coverage · 83.3% UAT pass rate, with 5 fails and blocks carried openly into go-live
One governed view of value, delivery risk, supplier performance and overdue cash.
The 420-order model carries a data dictionary, a SQL star schema, reusable DAX measures, eight KPIs, an Excel control tower and BA artifacts — feeding one interactive dashboard.
Dataset is synthetic. Model, analysis and deliverables are original work.
Credentials
Verified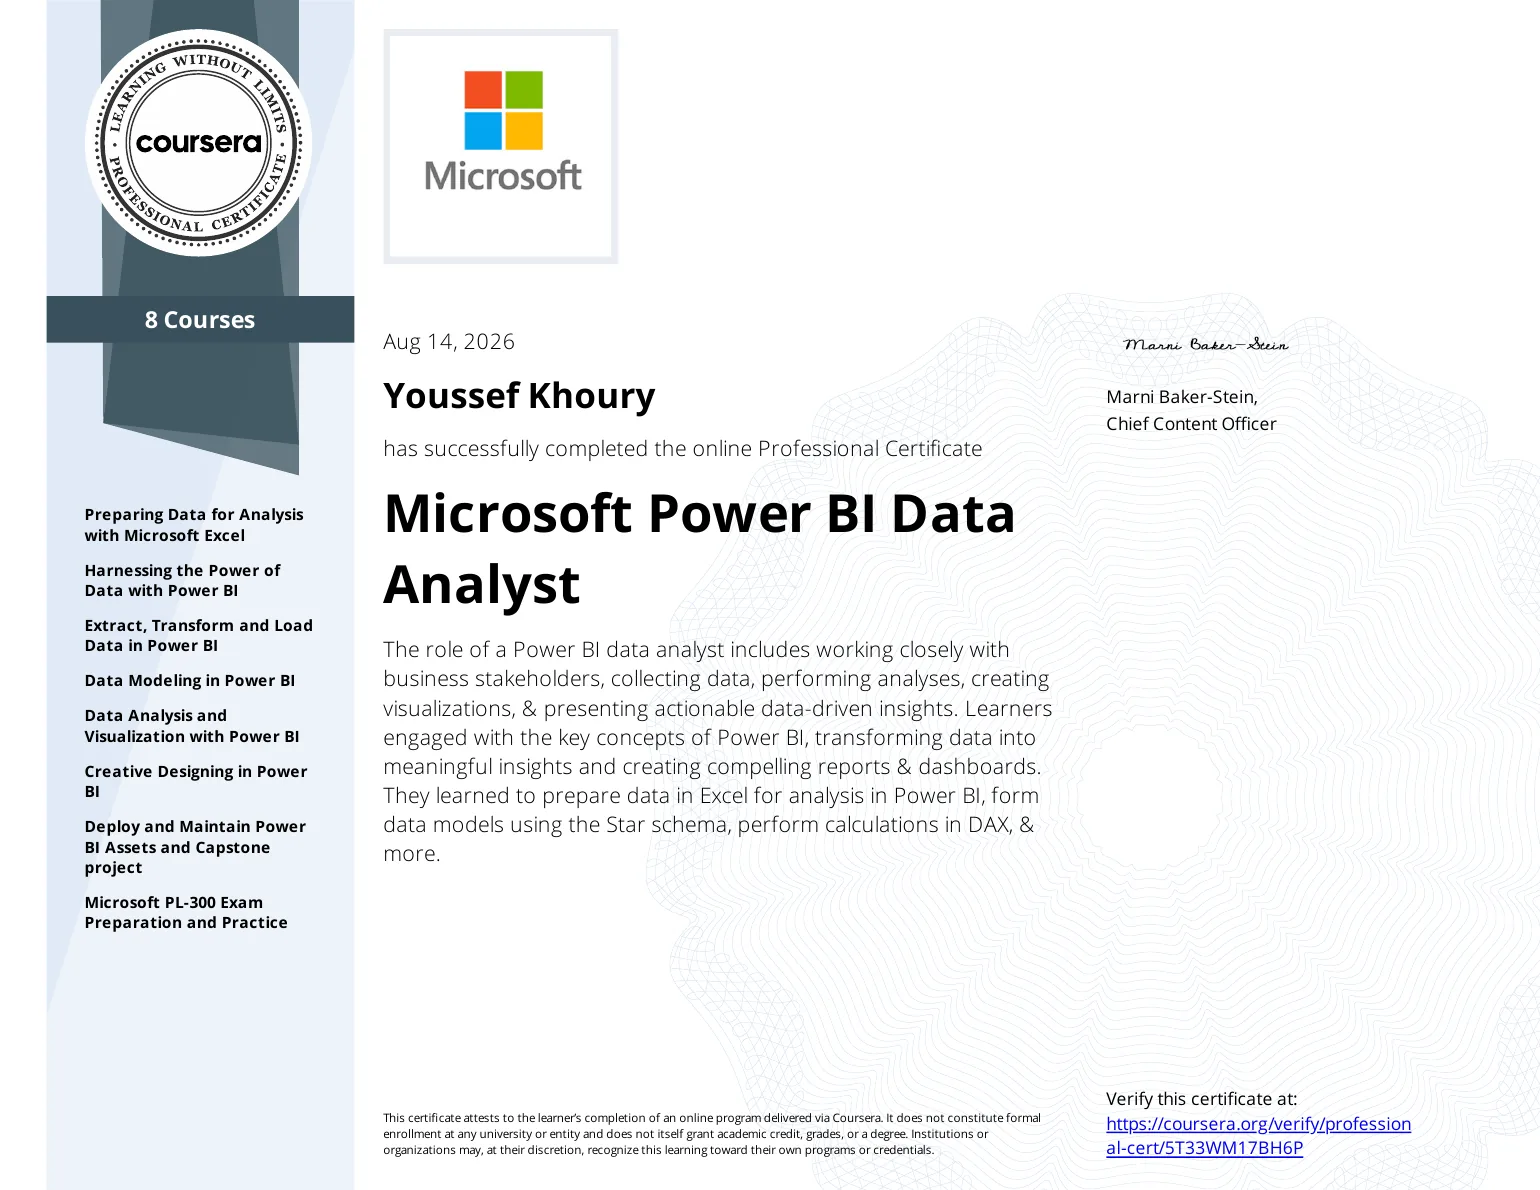
Power BI Data Analyst — Professional Certificate
Data preparation, modeling, visualization, analysis and dashboard delivery.
View PDF ↗
Business Analyst — Professional Certificate
Requirements, process modeling, stakeholder collaboration and solution evaluation.
View PDF ↗BBA — Management Information Systems · Matn University College · 2020–2024
Experience
2023 — NowOperations & Projects Lead Alta Light
Cut end-to-end order-to-delivery lead time from 2–3 months to about 2 weeks by mapping the process, tracing recurring delays to three root causes and rebuilding supplier follow-up; management adopted 3 of 5 recommendations. Run 40+ concurrent orders and projects worth $1M+ across 20+ suppliers, and built the Excel dashboard used for weekly operations reviews.
Operations Associate Alta Light
Coordinated day-to-day order-to-delivery execution across suppliers, purchasing and delivery follow-up — the operational grounding that led to the Lead role.
Administrator UPM
Maintained the Excel tracker for ~30 client accounts, reported delivery and receivables status, reconciled records against invoices and payments, owned daily client follow-up.
Financial Consultant SNA
Supported client needs assessments, underwriting submissions, policy documentation, claims, renewals and audit-ready client files.
Project Coordinator Facilitate International
Coordinated 500+ construction, maintenance and residential service requests for US and Canada clients — progress, quality, issues and updates.